Soufflé has a profiler, to help users understand the performance of their programs. Programmers can use the generated profile to identify performance bottlenecks in their program. These bottlenecks can then be addressed to reduce the runtime of their program.
The reasons for performance bottlenecks in programs can be manifold:
- Bad schedules (e.g., an ordering of atoms in a rule which leads to a bad join order).
- Wrong data-models (e.g., lack of database normalization using first, second, and third normal form), etc.
The issue of bad schedules can be almost entirely alleviated with Soufflé’s Auto-Scheduler. However, the Auto-Scheduler cannot always derive optimal schedules for all rules. Therefore, to achieve optimal performance manual tuning may be necessary.
To identify and eliminate performance bottlenecks, the following steps are to be performed:
- Execute the input program with profiling flags. As a side-effect of the execution a profile log is generated.
- Run the profiler (called
souffleprof) with the generated profile and identify performance bottlenecks - Improve the input program by eliminating performance bottlenecks if performance bottlenecks still exist.
- Continue with step 1 until no further bottlenecks can be found.
Getting Started
The program souffleprof is the profiler of Soufflé.
It provides detailed information about the performance of Soufflé programs.
The profiler requires a profile log as an input.
A profile log of an input program is generated by Soufflé with the option -p <log-file>.
By default, atoms frequency is not recorded.
If the user is interested in the frequency count, he or she can pass the --profile-frequency flag along with the -p flag.
Please note that with frequency enabled, the profiler cannot give an accurate measurement of the running time, especially under the interpreter mode.
If the user cares about both the running time and the atom frequency, it is recommended to run the profiler with and without --profile-frequency to get the most accurate result.
After running the program, the <log-file> is generated as a side-effect of the execution,
and can be displayed by the Soufflé profiler.
The Soufflé profiler provides a textual user interface, and a graphical user interface. As an additional feature, the profiler can run incomplete profile logs, i.e., partial profile information can be provided to the programmer while the Soufflé program is still running. We call this mode of execution, the live-mode. The off-line mode is the default mode of execution, i.e., the profile log is complete.
Running the Soufflé Profiler
To use the profiler, run the executable souffleprof.
The detailed usage instructions are as follows:
Usage: souffleprof <log-file> [ -h | -c <command> [options] | -j ]
<log-file>            The log file to profile.
-c <command>          Run the given command on the log file, try with  '-c help' for a list
                      of commands.
-j[filename]          Generate a GUI (html/js) version of the profiler.
                      Default filename is profiler_html/[num].html
-h                    Print this help message.
Examples: By default the text-user interface in offline mode is started with
souffleprof <file>
A profiling command is issued via an argument without opening the text-user interface:
souffleprof <file> -c <command>
The graphical user interface is generated as a html/js file using the option -j:
souffleprof <file> -j
Both the text- and graphical user interface provide the following views:
- A top-level view of the performance totals of a program.
- A table view of all the performance characteristics of all Relations.
- A table view of all the performance characteristics of all Rules.
- A table view of all the performance characteristics of all the Rules of a Relation.
- A table view of all the performance characteristics of all the versions of a Rule.
- A chart view of runtime, copy-time and total number of tuples per Iteration for a Relation.
- A chart view of runtime and total number of tuples per Iteration for a Rule.
- A chart view of runtime and total number of tuples per Version of a Rule.
Text User Interface
The text user interface is controlled by entering user commands. The available commands are:
Profiling commands: (Can be run using the -c flag)
  rel                           -     display relation table.
  rel <relation id>             -     display all rules of a given relation.
  rul                           -     display rule table
  rul <rule id>                 -     display all version of given rule.
  rul id                        -     display all rules names and ids.
  rul id <rule id>              -     display the rule name for the given rule id.
  graph <relation id> <type>    -     graph a relation by type: (tot_t/copy_t/tuples).
  graph <rule id> <type>        -     graph recursive (C) rule by type(tot_t/tuples).
  graph ver <rule id> <type>    -     graph recursive (C) rule versions by type(tot_t/copy_t/tuples).
  top                           -     display top-level summary of program run.
  help                          -     print this.

Interactive mode only commands:
  load <filename>               -     load the given profiler log file.
  open                          -     list stored souffle log files.
  open <filename>               -     open the given stored log file.
  save <filename>               -     store a copy of the souffle log file.
  sort <col number>             -     sort tables by given column number.
  q                             -     exit program.
Table Relation / Rule View
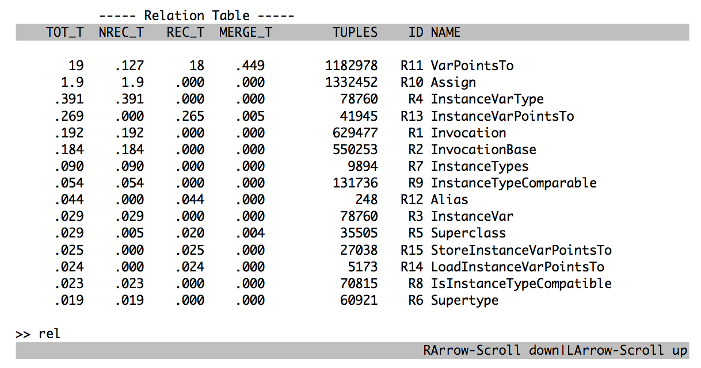
The table view shows the performance data for each Rule/Relation. Relation and Rules are referred to by their ID in commands. Relations can be referred to by their name or ID. Column TOT_T shows the total runtime of a relation/rule, column NREC_T the non-recursive portion of the runtime, column REC_T the recursive portion of the runtime, and column COPY_T the copy overheads while merging the newly found facts. The column TUPLES, ID, and NAME show the number of tuples produced, identifier of the relation/rule, and the name, respectively.
Graphical User Interface
The Soufflé profiler uses a browser to visualize the profile log.
To create a html/js file for profiling, run the profiler with the -j flag as below:
souffleprof <log file> -j
The html/js file will be saved in the current working directory as
./profiler_html/<version>.html where <version> is a unique number that
is incremented for each further invocation.
The graphical user interface is invoked by opening the html/js
file in any modern browser.
GUI usage instructions
The graphical user interface has the same functionality as the text user interface. The four tabs on the top bar represents the commands ‘top’, ‘rel’, ‘rul/rul id’ and ‘help’.

In both the Relations and Rules tab, a table shows the relations and rules of a program, respectively.
By selecting an table entry, more detailed information about the table entry will appear on the screen.
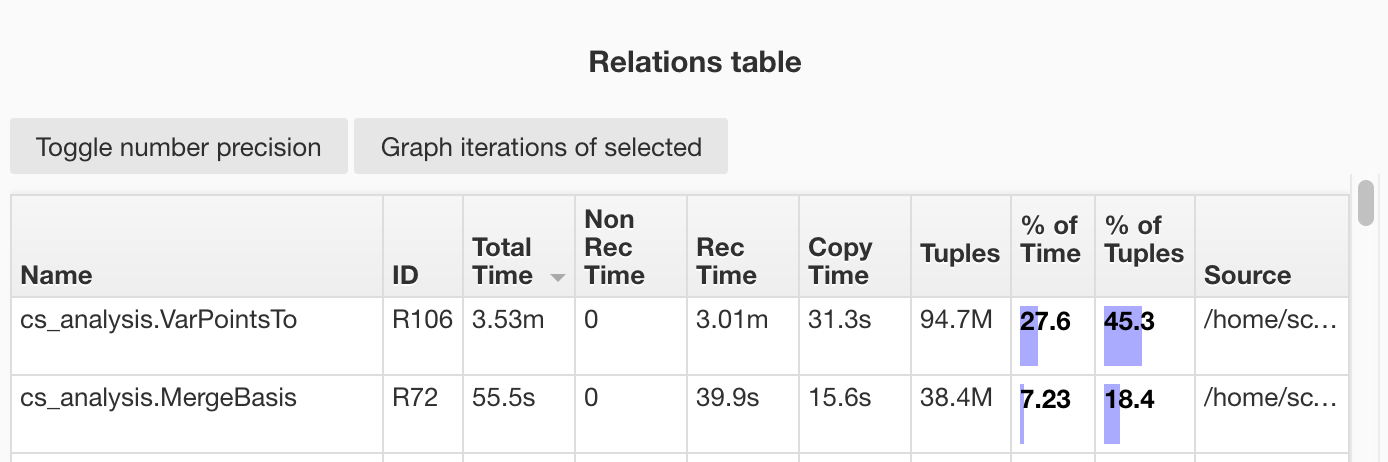
All tables are sortable by clicking on the table headers.
Number precision can be toggled within the whole document by clicking the button above the rule/relation table. Long strings are abbreviated and expanded by hovering the cursor over them.
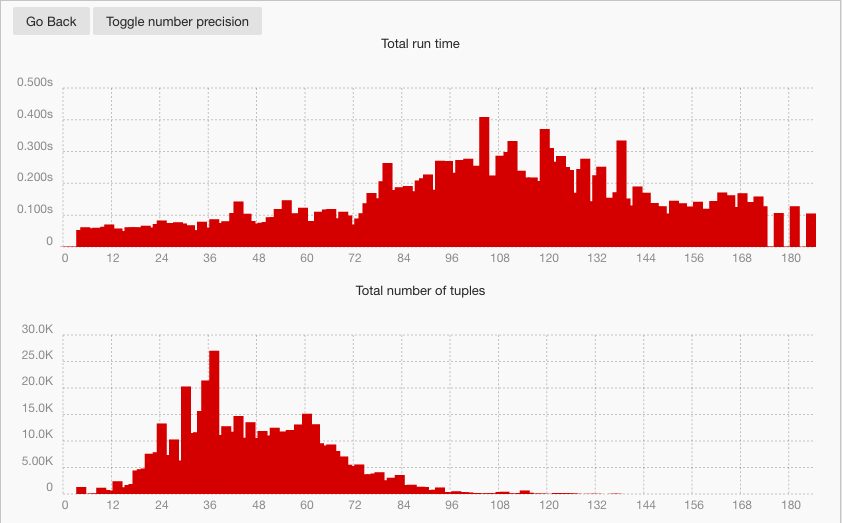
After a Relation is selected, it can be graphed to show a chart of total runtime and total number of tuples per Iteration.
After a recursive (ID beginning with C) Rule is selected, it can be graphed to show a chart of total runtime and total number of tuples per Iteration/Version.
By hovering over the graphs with a cursor, the values of individual versions/iterations can be seen. The precision of these can be toggled by pressing the button at the top of the page.