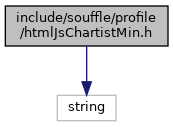
#include <string>

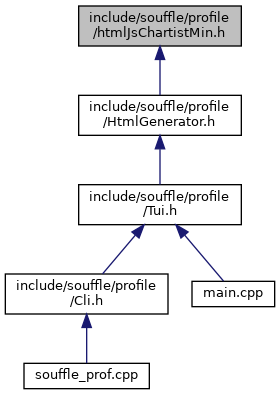
Go to the source code of this file.
Namespaces | |
| souffle | |
| souffle::profile | |
| souffle::profile::html | |
Functions | |
| l | createGridAndLabels (e, h, this.supportsForeignObject, a, this.eventEmitter) |
| l j a showGridBackground &&c | createGridBackground (e, o, a.classNames.gridBackground, this.eventEmitter) |
| l j a showGridBackground &&c b raw series this eventEmitter | emit ("created",{bounds:j.bounds, chartRect:o, axisX:m, axisY:n, svg:this.svg, options:a})}function e(a |
| l j a showGridBackground &&c b raw series | forEach (function(d, e){var f, h, i=e-(b.raw.series.length-1)/2;f=a.distributeSeries &&!a.stackBars?l.axisLength/b.normalized.series.length/2:a.distributeSeries &&a.stackBars?l.axisLength/2:l.axisLength/b.normalized.series[e].length/2, h=g.elem("g"), h.attr({"ct:series-name":d.name,"ct:meta":c.serialize(d.meta)}), h.addClass([a.classNames.series, d.className||a.classNames.series+"-"+c.alphaNumerate(e)].join(" ")), b.normalized.series[e].forEach(function(g, k){var r, s, t, u;if(u=a.distributeSeries &&!a.stackBars?e:a.distributeSeries &&a.stackBars?0:k, r=a.horizontalBars?{x:o.x1+j.projectValue(g &&g.x?g.x:0, k, b.normalized.series[e]), y:o.y1-l.projectValue(g &&g.y?g.y:0, u, b.normalized.series[e])}:{x:o.x1+l.projectValue(g &&g.x?g.x:0, u, b.normalized.series[e]), y:o.y1-j.projectValue(g &&g.y?g.y:0, k, b.normalized.series[e])}, l instanceof c.StepAxis &&(l.options.stretch||(r[l.units.pos]+=f *(a.horizontalBars?-1:1)), r[l.units.pos]+=a.stackBars||a.distributeSeries?0:i *a.seriesBarDistance *(a.horizontalBars?-1:1)), t=q[k]||p, q[k]=t-(p-r[l.counterUnits.pos]), void 0!==g){var v={};v[l.units.pos+"1"]=r[l.units.pos], v[l.units.pos+"2"]=r[l.units.pos],!a.stackBars||"accumulate"!==a.stackMode &&a.stackMode?(v[l.counterUnits.pos+"1"]=p, v[l.counterUnits.pos+"2"]=r[l.counterUnits.pos]):(v[l.counterUnits.pos+"1"]=t, v[l.counterUnits.pos+"2"]=q[k]), v.x1=Math.min(Math.max(v.x1, o.x1), o.x2), v.x2=Math.min(Math.max(v.x2, o.x1), o.x2), v.y1=Math.min(Math.max(v.y1, o.y2), o.y1), v.y2=Math.min(Math.max(v.y2, o.y2), o.y1);var w=c.getMetaData(d, k);s=h.elem("line", v, a.classNames.bar).attr({"ct:value":[g.x, g.y].filter(c.isNumeric).join(","),"ct:meta":c.serialize(w)}), this.eventEmitter.emit("draw", c.extend({type:"bar", value:g, index:k, meta:w, series:d, seriesIndex:e, axisX:m, axisY:n, chartRect:o, group:h, element:s}, v))}}.bind(this))}.bind(this)) |
Variables | |
| ___ | |
| l j a showGridBackground &&c b raw series this eventEmitter | b |
| c | Bar =c.Base.extend({constructor:e,createChart:d})}(window,document,a),function(a,b,c){"use strict";function d(a,b,c){var d=b.x>a.x;return d&&"explode"===c||!d&&"implode"===c?"start":d&&"implode"===c||!d&&"explode"===c?"end":"middle"}function e(a){var b,e,f,h,i,j=c.normalizeData(this.data),k=[],l=a.startAngle;this.svg=c.createSvg(this.container,a.width,a.height,a.donut?a.classNames.chartDonut:a.classNames.chartPie),e=c.createChartRect(this.svg,a,g.padding),f=Math.min(e.width()/2,e.height()/2),i=a.total||j.normalized.series.reduce(function(a,b){return a+b},0);var m=c.quantity(a.donutWidth);"%"===m.unit&&(m.value*=f/100),f-=a.donut?m.value/2:0,h="outside"===a.labelPosition||a.donut?f:"center"===a.labelPosition?0:f/2,h+=a.labelOffset;var n={x:e.x1+e.width()/2,y:e.y2+e.height()/2},o=1===j.raw.series.filter(function(a){return a.hasOwnProperty("value")?0!==a.value:0!==a}).length;j.raw.series.forEach(function(a,b){k[b]=this.svg.elem("g",null,null)}.bind(this)),a.showLabel&&(b=this.svg.elem("g",null,null)),j.raw.series.forEach(function(e,g){if(0!==j.normalized.series[g]||!a.ignoreEmptyValues){k[g].attr({"ct:series-name":e.name}),k[g].addClass([a.classNames.series,e.className||a.classNames.series+"-"+c.alphaNumerate(g)].join(" "));var p=i>0?l+j.normalized.series[g]/i*360:0,q=Math.max(0,l-(0===g||o?0:.2));p-q>=359.99&&(p=q+359.99);var r=c.polarToCartesian(n.x,n.y,f,q),s=c.polarToCartesian(n.x,n.y,f,p),t=new c.Svg.Path((!a.donut)).move(s.x,s.y).arc(f,f,0,p-l>180,0,r.x,r.y);a.donut||t.line(n.x,n.y);var u=k[g].elem("path",{d:t.stringify()},a.donut?a.classNames.sliceDonut:a.classNames.slicePie);if(u.attr({"ct:value":j.normalized.series[g],"ct:meta":c.serialize(e.meta)}),a.donut&&u.attr({style:"stroke-width: "+m.value+"px"}),this.eventEmitter.emit("draw",{type:"slice",value:j.normalized.series[g],totalDataSum:i,index:g,meta:e.meta,series:e,group:k[g],element:u,path:t.clone(),center:n,radius:f,startAngle:l,endAngle:p}),a.showLabel){var v;v=1===j.raw.series.length?{x:n.x,y:n.y}:c.polarToCartesian(n.x,n.y,h,l+(p-l)/2);var w;w=j.normalized.labels&&!c.isFalseyButZero(j.normalized.labels[g])?j.normalized.labels[g]:j.normalized.series[g];var x=a.labelInterpolationFnc(w,g);if(x||0===x){var y=b.elem("text",{dx:v.x,dy:v.y,"text-anchor":d(n,v,a.labelDirection)},a.classNames.label).text(""+x);this.eventEmitter.emit("draw",{type:"label",index:g,group:b,element:y,text:""+x,x:v.x,y:v.y})}}l=p}}.bind(this)),this.eventEmitter.emit("created",{chartRect:e,svg:this.svg,options:a})}function f(a,b,d,e){c.Pie["super"].constructor.call(this,a,b,g,c.extend({},g,d),e)}var g={width:void 0,height:void 0,chartPadding:5,classNames:{chartPie:"ct-chart-pie",chartDonut:"ct-chart-donut",series:"ct-series",slicePie:"ct-slice-pie",sliceDonut:"ct-slice-donut",label:"ct-label"},startAngle:0,total:void 0,donut:!1,donutWidth:60,showLabel:!0,labelOffset:0,labelPosition:"inside",labelInterpolationFnc:c.noop,labelDirection:"neutral",reverseData:!1,ignoreEmptyValues:!1};c.Pie=c.Base.extend({constructor:f,createChart:e,determineAnchorPosition:d})}(window,document,a),a}) |
| else | d =c.getHighLow(b.normalized.series,a,a.horizontalBars?"x":"y") |
| l j a showGridBackground &&c b raw series this eventEmitter | e {c.Bar["super"].constructor.call(this,a,b,f,c.extend({},f,d),e)}var f={axisX:{offset:30,position:"end",labelOffset:{x:0,y:0},showLabel:!0,showGrid:!0,labelInterpolationFnc:c.noop,scaleMinSpace:30,onlyInteger:!1},axisY:{offset:40,position:"start",labelOffset:{x:0,y:0},showLabel:!0,showGrid:!0,labelInterpolationFnc:c.noop,scaleMinSpace:20,onlyInteger:!1},width:void 0,height:void 0,high:void 0,low:void 0,referenceValue:0,chartPadding:{top:15,right:15,bottom:5,left:10},seriesBarDistance:15,stackBars:!1,stackMode:"accumulate",horizontalBars:!1,distributeSeries:!1,reverseData:!1,showGridBackground:!1,classNames:{chart:"ct-chart-bar",horizontalBars:"ct-horizontal-bars",label:"ct-label",labelGroup:"ct-labels",series:"ct-series",bar:"ct-bar",grid:"ct-grid",gridGroup:"ct-grids",gridBackground:"ct-grid-background",vertical:"ct-vertical",horizontal:"ct-horizontal",start:"ct-start",end:"ct-end"}} |
| d | high =+a.high||(0===a.high?0:d.high) |
| var | j |
| var | k =a.distributeSeries&&a.stackBars?b.normalized.labels.slice(0,1):b.normalized.labels |
| var | l |
| d d | low =+a.low||(0===a.low?0:d.low) |
| var | m |
| var | n |
| var | o =c.createChartRect(this.svg,a,f.padding) |
| a horizontalBars(j=m=void 0===a.axisX.type?new c.AutoScaleAxis(c.Axis.units.x, b.normalized.series, o, c.extend({}, a.axisX,{highLow:d, referenceValue:0})):a.axisX.type.call(c, c.Axis.units.x, b.normalized.series, o, c.extend({}, a.axisX,{highLow:d, referenceValue:0})), l=n=void 0===a.axisY.type?new c.StepAxis(c.Axis.units.y, b.normalized.series, o,{ticks:k}):a.axisY.type.call(c, c.Axis.units.y, b.normalized.series, o, a.axisY)) var | p =a.horizontalBars?o.x1+j.projectValue(0):o.y1-j.projectValue(0) |
| a horizontalBars(j=m=void 0===a.axisX.type?new c.AutoScaleAxis(c.Axis.units.x, b.normalized.series, o, c.extend({}, a.axisX,{highLow:d, referenceValue:0})):a.axisX.type.call(c, c.Axis.units.x, b.normalized.series, o, c.extend({}, a.axisX,{highLow:d, referenceValue:0})), l=n=void 0===a.axisY.type?new c.StepAxis(c.Axis.units.y, b.normalized.series, o,{ticks:k}):a.axisY.type.call(c, c.Axis.units.y, b.normalized.series, o, a.axisY)) var | q =[] |
Function Documentation
◆ createGridAndLabels()
◆ createGridBackground()
| l j a showGridBackground&& c createGridBackground | ( | e | , |
| o | , | ||
| a.classNames. | gridBackground, | ||
| this. | eventEmitter | ||
| ) |
◆ emit()
| l j a showGridBackground&& c b raw series this eventEmitter emit | ( | "created" | , |
| {bounds:j.bounds, chartRect:o, axisX:m, axisY:n, svg:this.svg, options:a} | |||
| ) |
◆ forEach()
| l j a showGridBackground&& c b raw series forEach | ( | function(d, e){var f, h, i=e-(b.raw.series.length-1)/2;f=a.distributeSeries &&!a.stackBars?l.axisLength/b.normalized.series.length/2:a.distributeSeries &&a.stackBars?l.axisLength/2:l.axisLength/b.normalized.series[e].length/2, h=g.elem("g"), h.attr({"ct:series-name":d.name,"ct:meta":c.serialize(d.meta)}), h.addClass([a.classNames.series, d.className||a.classNames.series+"-"+c.alphaNumerate(e)].join(" ")), b.normalized.series[e].forEach(function(g, k){var r, s, t, u;if(u=a.distributeSeries &&!a.stackBars?e:a.distributeSeries &&a.stackBars?0:k, r=a.horizontalBars?{x:o.x1+j.projectValue(g &&g.x?g.x:0, k, b.normalized.series[e]), y:o.y1-l.projectValue(g &&g.y?g.y:0, u, b.normalized.series[e])}:{x:o.x1+l.projectValue(g &&g.x?g.x:0, u, b.normalized.series[e]), y:o.y1-j.projectValue(g &&g.y?g.y:0, k, b.normalized.series[e])}, l instanceof c.StepAxis &&(l.options.stretch||(r[l.units.pos]+=f *(a.horizontalBars?-1:1)), r[l.units.pos]+=a.stackBars||a.distributeSeries?0:i *a.seriesBarDistance *(a.horizontalBars?-1:1)), t=q[k]||p, q[k]=t-(p-r[l.counterUnits.pos]), void 0!==g){var v={};v[l.units.pos+"1"]=r[l.units.pos], v[l.units.pos+"2"]=r[l.units.pos],!a.stackBars||"accumulate"!==a.stackMode &&a.stackMode?(v[l.counterUnits.pos+"1"]=p, v[l.counterUnits.pos+"2"]=r[l.counterUnits.pos]):(v[l.counterUnits.pos+"1"]=t, v[l.counterUnits.pos+"2"]=q[k]), v.x1=Math.min(Math.max(v.x1, o.x1), o.x2), v.x2=Math.min(Math.max(v.x2, o.x1), o.x2), v.y1=Math.min(Math.max(v.y1, o.y2), o.y1), v.y2=Math.min(Math.max(v.y2, o.y2), o.y1);var w=c.getMetaData(d, k);s=h.elem("line", v, a.classNames.bar).attr({"ct:value":[g.x, g.y].filter(c.isNumeric).join(","),"ct:meta":c.serialize(w)}), this.eventEmitter.emit("draw", c.extend({type:"bar", value:g, index:k, meta:w, series:d, seriesIndex:e, axisX:m, axisY:n, chartRect:o, group:h, element:s}, v))}}.bind(this))}.bind(this) | ) |
Variable Documentation
◆ ___
| ___ |
Definition at line 18 of file htmlJsChartistMin.h.
◆ b
Definition at line 15 of file htmlJsChartistMin.h.
Referenced by souffle::btree_multiset< Key, Comparator, Allocator, blockSize, SearchStrategy, WeakComparator, Updater >::btree_multiset(), souffle::btree_set< Key, Comparator, Allocator, blockSize, SearchStrategy, WeakComparator, Updater >::btree_set(), souffle::profile::DataComparator::C_T(), souffle::detail::btree< Key, detail::comparator< Key >, std::allocator< Key >, blockSize, typename detail::default_strategy< Key >::type, isSet, detail::comparator< Key >, detail::updater< Key > >::check(), souffle::clone(), souffle::ast::analysis::TypeSet::end(), souffle::equal_targets(), souffle::profile::DataComparator::ID(), souffle::join(), souffle::LambdaBTreeSet< StorePair, std::function< StatesBucket(StorePair &)>, souffle::EqrelMapComparator< StorePair > >::LambdaBTreeSet(), souffle::detail::btree< Key, detail::comparator< Key >, std::allocator< Key >, blockSize, typename detail::default_strategy< Key >::type, isSet, detail::comparator< Key >, detail::updater< Key > >::less(), souffle::detail::linear_search::lower_bound(), souffle::profile::DataComparator::NAME(), souffle::profile::DataComparator::NR_T(), souffle::ast::analysis::detail::default_bottom_factory< T >::operator()(), souffle::detail::brie::default_factory< T >::operator()(), souffle::btree_set< Key, Comparator, Allocator, blockSize, SearchStrategy, WeakComparator, Updater >::operator=(), souffle::btree_multiset< Key, Comparator, Allocator, blockSize, SearchStrategy, WeakComparator, Updater >::operator=(), souffle::DisjointSet::pr2b(), souffle::ast::analysis::TypeEnvironment::print(), souffle::profile::DataComparator::R_T(), souffle::ram::transform::ReorderConditionsTransformer::reorderConditions(), souffle::ast::analysis::sub(), souffle::ram::test::TEST(), souffle::test::TEST(), souffle::TEST(), souffle::profile::DataComparator::TIME(), souffle::test::time(), and souffle::profile::DataComparator::TUP().
◆ Bar
| c Bar =c.Base.extend({constructor:e,createChart:d})}(window,document,a),function(a,b,c){"use strict";function d(a,b,c){var d=b.x>a.x;return d&&"explode"===c||!d&&"implode"===c?"start":d&&"implode"===c||!d&&"explode"===c?"end":"middle"}function e(a){var b,e,f,h,i,j=c.normalizeData(this.data),k=[],l=a.startAngle;this.svg=c.createSvg(this.container,a.width,a.height,a.donut?a.classNames.chartDonut:a.classNames.chartPie),e=c.createChartRect(this.svg,a,g.padding),f=Math.min(e.width()/2,e.height()/2),i=a.total||j.normalized.series.reduce(function(a,b){return a+b},0);var m=c.quantity(a.donutWidth);"%"===m.unit&&(m.value*=f/100),f-=a.donut?m.value/2:0,h="outside"===a.labelPosition||a.donut?f:"center"===a.labelPosition?0:f/2,h+=a.labelOffset;var n={x:e.x1+e.width()/2,y:e.y2+e.height()/2},o=1===j.raw.series.filter(function(a){return a.hasOwnProperty("value")?0!==a.value:0!==a}).length;j.raw.series.forEach(function(a,b){k[b]=this.svg.elem("g",null,null)}.bind(this)),a.showLabel&&(b=this.svg.elem("g",null,null)),j.raw.series.forEach(function(e,g){if(0!==j.normalized.series[g]||!a.ignoreEmptyValues){k[g].attr({"ct:series-name":e.name}),k[g].addClass([a.classNames.series,e.className||a.classNames.series+"-"+c.alphaNumerate(g)].join(" "));var p=i>0?l+j.normalized.series[g]/i*360:0,q=Math.max(0,l-(0===g||o?0:.2));p-q>=359.99&&(p=q+359.99);var r=c.polarToCartesian(n.x,n.y,f,q),s=c.polarToCartesian(n.x,n.y,f,p),t=new c.Svg.Path((!a.donut)).move(s.x,s.y).arc(f,f,0,p-l>180,0,r.x,r.y);a.donut||t.line(n.x,n.y);var u=k[g].elem("path",{d:t.stringify()},a.donut?a.classNames.sliceDonut:a.classNames.slicePie);if(u.attr({"ct:value":j.normalized.series[g],"ct:meta":c.serialize(e.meta)}),a.donut&&u.attr({style:"stroke-width: "+m.value+"px"}),this.eventEmitter.emit("draw",{type:"slice",value:j.normalized.series[g],totalDataSum:i,index:g,meta:e.meta,series:e,group:k[g],element:u,path:t.clone(),center:n,radius:f,startAngle:l,endAngle:p}),a.showLabel){var v;v=1===j.raw.series.length?{x:n.x,y:n.y}:c.polarToCartesian(n.x,n.y,h,l+(p-l)/2);var w;w=j.normalized.labels&&!c.isFalseyButZero(j.normalized.labels[g])?j.normalized.labels[g]:j.normalized.series[g];var x=a.labelInterpolationFnc(w,g);if(x||0===x){var y=b.elem("text",{dx:v.x,dy:v.y,"text-anchor":d(n,v,a.labelDirection)},a.classNames.label).text(""+x);this.eventEmitter.emit("draw",{type:"label",index:g,group:b,element:y,text:""+x,x:v.x,y:v.y})}}l=p}}.bind(this)),this.eventEmitter.emit("created",{chartRect:e,svg:this.svg,options:a})}function f(a,b,d,e){c.Pie["super"].constructor.call(this,a,b,g,c.extend({},g,d),e)}var g={width:void 0,height:void 0,chartPadding:5,classNames:{chartPie:"ct-chart-pie",chartDonut:"ct-chart-donut",series:"ct-series",slicePie:"ct-slice-pie",sliceDonut:"ct-slice-donut",label:"ct-label"},startAngle:0,total:void 0,donut:!1,donutWidth:60,showLabel:!0,labelOffset:0,labelPosition:"inside",labelInterpolationFnc:c.noop,labelDirection:"neutral",reverseData:!1,ignoreEmptyValues:!1};c.Pie=c.Base.extend({constructor:f,createChart:e,determineAnchorPosition:d})}(window,document,a),a}) |
Definition at line 15 of file htmlJsChartistMin.h.
◆ d
| l j a showGridBackground &&c b raw series this eventEmitter d =c.getHighLow(b.normalized.series,a,a.horizontalBars?"x":"y") |
Definition at line 15 of file htmlJsChartistMin.h.
Referenced by graphByTime(), and souffle::test::TEST().
◆ e
| l j a showGridBackground&& c b raw series this eventEmitter e {c.Bar["super"].constructor.call(this,a,b,f,c.extend({},f,d),e)}var f={axisX:{offset:30,position:"end",labelOffset:{x:0,y:0},showLabel:!0,showGrid:!0,labelInterpolationFnc:c.noop,scaleMinSpace:30,onlyInteger:!1},axisY:{offset:40,position:"start",labelOffset:{x:0,y:0},showLabel:!0,showGrid:!0,labelInterpolationFnc:c.noop,scaleMinSpace:20,onlyInteger:!1},width:void 0,height:void 0,high:void 0,low:void 0,referenceValue:0,chartPadding:{top:15,right:15,bottom:5,left:10},seriesBarDistance:15,stackBars:!1,stackMode:"accumulate",horizontalBars:!1,distributeSeries:!1,reverseData:!1,showGridBackground:!1,classNames:{chart:"ct-chart-bar",horizontalBars:"ct-horizontal-bars",label:"ct-label",labelGroup:"ct-labels",series:"ct-series",bar:"ct-bar",grid:"ct-grid",gridGroup:"ct-grids",gridBackground:"ct-grid-background",vertical:"ct-vertical",horizontal:"ct-horizontal",start:"ct-start",end:"ct-end"}} |
Definition at line 15 of file htmlJsChartistMin.h.
Referenced by souffle::EquivalenceRelation< Arity >::clear(), souffle::interpreter::Engine::execute(), souffle::Explain::processCommand(), souffle::profile::Reader::Reader(), souffle::test::TEST(), and souffle::toVector().
◆ high
| d high =+a.high||(0===a.high?0:d.high) |
Definition at line 15 of file htmlJsChartistMin.h.
Referenced by souffle::interpreter::Index< _Arity, Structure >::View::contains(), souffle::interpreter::Index< 2, Eqrel >::contains(), souffle::interpreter::Relation< 2, Eqrel >::contains(), souffle::interpreter::Relation< 2, Eqrel >::partitionScan(), souffle::interpreter::Relation< 2, Eqrel >::range(), and souffle::interpreter::Index< 2, Eqrel >::scan().
◆ j
| var j |
Definition at line 15 of file htmlJsChartistMin.h.
Referenced by souffle::ram::transform::EliminateDuplicatesTransformer::eliminateDuplicates(), souffle::RuleBody::equal(), souffle::ast::transform::MinimiseProgramTransformer::existsValidPermutation(), souffle::synthesiser::BrieRelation::generateTypeStruct(), souffle::synthesiser::EqrelRelation::generateTypeStruct(), souffle::ast::transform::getInlinedArgument(), souffle::ast::transform::getInlinedAtom(), graphBySize(), graphByTime(), souffle::RuleBody::isSubsetOf(), memoryUsage(), souffle::ExplainProvenanceImpl::queryProcess(), souffle::ast::transform::MinimiseProgramTransformer::reduceClauseBodies(), souffle::detail::btree< Key, Comparator, Allocator, blockSize, SearchStrategy, isSet, WeakComparator, Updater >::node::split(), souffle::test::TEST(), souffle::TEST(), and usage().
◆ k
| k =a.distributeSeries&&a.stackBars?b.normalized.labels.slice(0,1):b.normalized.labels |
Definition at line 15 of file htmlJsChartistMin.h.
Referenced by souffle::detail::btree< Key, detail::comparator< Key >, std::allocator< Key >, blockSize, typename detail::default_strategy< Key >::type, isSet, detail::comparator< Key >, detail::updater< Key > >::contains(), souffle::detail::btree< Key, detail::comparator< Key >, std::allocator< Key >, blockSize, typename detail::default_strategy< Key >::type, isSet, detail::comparator< Key >, detail::updater< Key > >::covers(), souffle::detail::btree< Key, detail::comparator< Key >, std::allocator< Key >, blockSize, typename detail::default_strategy< Key >::type, isSet, detail::comparator< Key >, detail::updater< Key > >::find(), souffle::test::getData(), souffle::detail::linear_search::lower_bound(), souffle::detail::btree< Key, detail::comparator< Key >, std::allocator< Key >, blockSize, typename detail::default_strategy< Key >::type, isSet, detail::comparator< Key >, detail::updater< Key > >::lower_bound(), souffle::detail::btree< Key, detail::comparator< Key >, std::allocator< Key >, blockSize, typename detail::default_strategy< Key >::type, isSet, detail::comparator< Key >, detail::updater< Key > >::partition(), souffle::InnerNode::place(), souffle::TEST(), souffle::detail::btree< Key, detail::comparator< Key >, std::allocator< Key >, blockSize, typename detail::default_strategy< Key >::type, isSet, detail::comparator< Key >, detail::updater< Key > >::upper_bound(), and souffle::detail::btree< Key, detail::comparator< Key >, std::allocator< Key >, blockSize, typename detail::default_strategy< Key >::type, isSet, detail::comparator< Key >, detail::updater< Key > >::weak_covers().
◆ l
| var l |
Definition at line 15 of file htmlJsChartistMin.h.
Referenced by graphBySize(), and souffle::ExplainProvenanceImpl::queryProcess().
◆ low
Definition at line 15 of file htmlJsChartistMin.h.
Referenced by souffle::interpreter::Index< _Arity, Structure >::View::contains(), souffle::interpreter::Index< 2, Eqrel >::contains(), souffle::interpreter::Relation< 2, Eqrel >::contains(), souffle::interpreter::Relation< 2, Eqrel >::partitionScan(), souffle::interpreter::Relation< 2, Eqrel >::range(), and souffle::interpreter::Index< 2, Eqrel >::scan().
◆ m
| var m |
Definition at line 15 of file htmlJsChartistMin.h.
Referenced by std::operator<<(), and TEST().
◆ n
| var n |
Definition at line 15 of file htmlJsChartistMin.h.
Referenced by souffle::range< souffle::detail::brie::TrieIterator >::empty(), souffle::ExplainProvenanceImpl::findTuple(), tinyformat::detail::parseWidthOrPrecision(), souffle::TEST(), and souffle::ast::visitDepthFirst().
◆ o
| var o =c.createChartRect(this.svg,a,f.padding) |
Definition at line 15 of file htmlJsChartistMin.h.
Referenced by souffle::Relation::iterator::iterator(), souffle::Relation::iterator_base::iterator_base(), souffle::Relation::iterator::operator*(), and souffle::Relation::iterator::operator==().
◆ p
| a horizontalBars (j=m=void 0===a.axisX.type?new c.AutoScaleAxis(c.Axis.units.x,b.normalized.series,o,c.extend({},a.axisX,{highLow:d,referenceValue:0})):a.axisX.type.call(c,c.Axis.units.x,b.normalized.series,o,c.extend({},a.axisX,{highLow:d,referenceValue:0})),l=n=void 0===a.axisY.type?new c.StepAxis(c.Axis.units.y,b.normalized.series,o,{ticks:k}):a.axisY.type.call(c,c.Axis.units.y,b.normalized.series,o,a.axisY)) var p =a.horizontalBars?o.x1+j.projectValue(0):o.y1-j.projectValue(0) |
Definition at line 15 of file htmlJsChartistMin.h.
Referenced by souffle::ParserDriver::addPragma(), souffle::all_of(), souffle::any_of(), souffle::EquivalenceRelation< Arity >::closure(), souffle::EquivalenceRelation< Arity >::insert(), souffle::join(), main(), std::operator<<(), souffle::range< souffle::detail::brie::TrieIterator >::partition(), and TEST().
◆ q
| a horizontalBars (j=m=void 0===a.axisX.type?new c.AutoScaleAxis(c.Axis.units.x,b.normalized.series,o,c.extend({},a.axisX,{highLow:d,referenceValue:0})):a.axisX.type.call(c,c.Axis.units.x,b.normalized.series,o,c.extend({},a.axisX,{highLow:d,referenceValue:0})),l=n=void 0===a.axisY.type?new c.StepAxis(c.Axis.units.y,b.normalized.series,o,{ticks:k}):a.axisY.type.call(c,c.Axis.units.y,b.normalized.series,o,a.axisY)) var q =[] |
Definition at line 15 of file htmlJsChartistMin.h.
 1.8.17